CASE STUDY · PERSONAL ·
Northwind Dashboard
A Fast Analytics UI
ReactTypeScriptNode.jsPostgreSQL
This is sample content that ships with the quietfolio template. Replace it with your own case study.
Overview
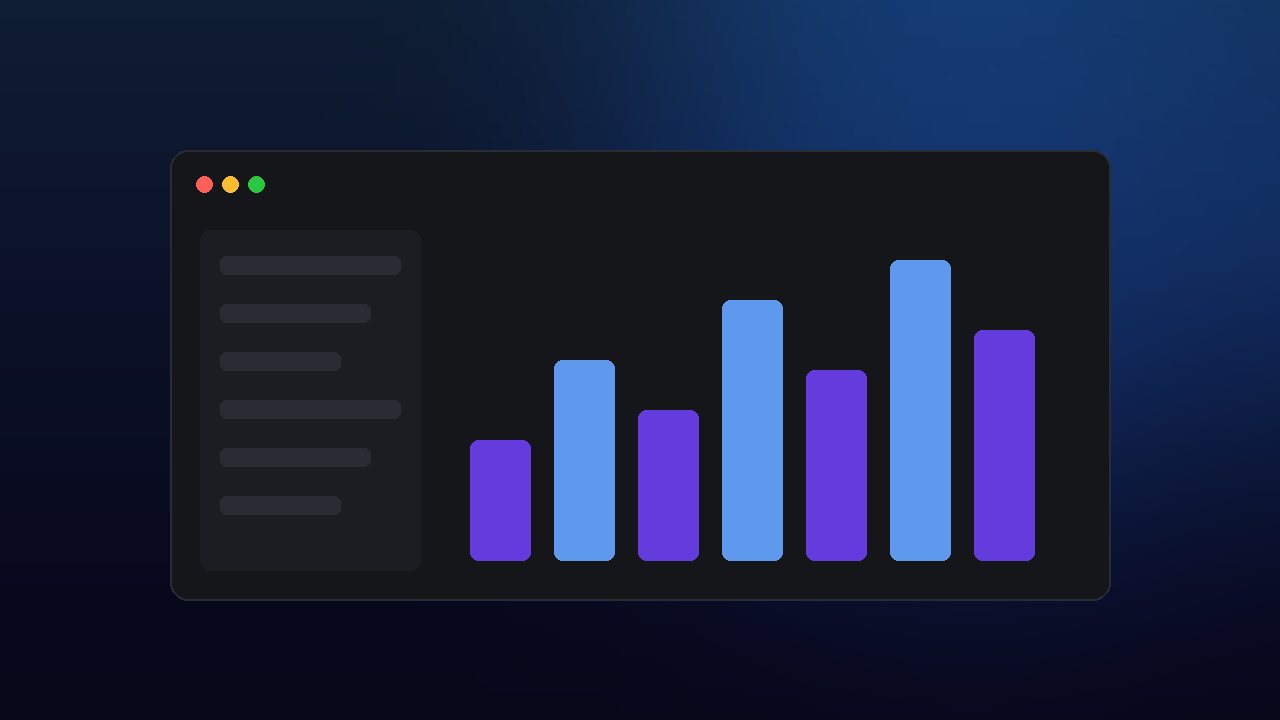
Northwind Dashboard is a sample analytics app used to show how a case study page looks: a cover image, a short intro, headings, lists, code and a table, all rendered from content/work.json.
Good case studies answer three questions quickly: what was the problem, what did you build, and what changed because of it.
The problem
Teams were exporting spreadsheets by hand every Monday. Numbers were stale by Tuesday and nobody trusted the totals.
What I built
- Live charts — a typed API streams aggregates so the UI never recomputes them in the browser.
- Role-based access — admins see everything, viewers see only their team.
- CSV export — one click, the same numbers as the screen.
A detail worth showing
Short code snippets render in a scrollable block. For example, the query that powers the weekly chart:
SELECT date_trunc('week', created_at) AS week, sum(amount) AS total
FROM orders
WHERE team_id = $1
GROUP BY 1
ORDER BY 1;
Results
| Metric | Before | After |
|---|---|---|
| Weekly report time | 2 hours | Instant |
| Dashboard load | 4.1 s | 0.9 s |
| Support tickets about totals | 12 / month | 0 |
Links
See the live demo or read how this template works.